|
iQue Forecyt® Reference Guide (Version 9.0)
|
Well Identification

About Well Identification
When you run a plate the sampling process records all data continuously into one FCS file. Well Identification is the process by which iQue Forecyt® parses the data generated from sampling your plate and determines which sections of the data correspond to samples taken from specific wells of a plate. Well ID is a very important step in setting up your experiment for future analyses and ensuring the validity of your data.
Tips for Achieving Accurate Well ID
- Do not discard your plate until after you have performed Well Identification and verified the wells.
- Marker beads facilitate more accurate Well Identification, particularly if your experiment involves killing cells. (See Markers.)
- Positive and Negative Controls on your plate also help with Well Identification because they are known entities.
- Make sure you follow the recommended maintenance schedule for your instrument.
- Use QSol buffer when working with sticky samples.
- Increase sip time in Protocol if you have low density samples.
- Create a noise gate around beads or cells.
- Try selecting a different algorithm in Algorithm Selector from the Algorithm drop-down list if you suspect problems with Well ID.
- Check for flagged wells, they might indicate a problem with Well Id or sample preparation.
The data file associated with your plate contains peaks and valleys of events. The peaks correspond to times when the probe is sampling from a well and the valleys correspond to times when the probe is outside of wells. These are the conditions when the probe samples outside of a well:
- The probe travels from well to well.
- The probe travels from well to rinse, clean, or buffer station.
- The probe cycles at a rinse station.
When the probe travels from well to well, and, in transit to the rinse or buffer station, it is sampling air and detects no cells or beads. When the probe cycles at the rinse station it will sample air as well as fluid from one of the rinse stations. This fluid does not contain a detectable number cells or beads. The absence of detectable particles is represented as a valley in the data file. The valleys may show a few particles due to carry-over but the number will be very low.
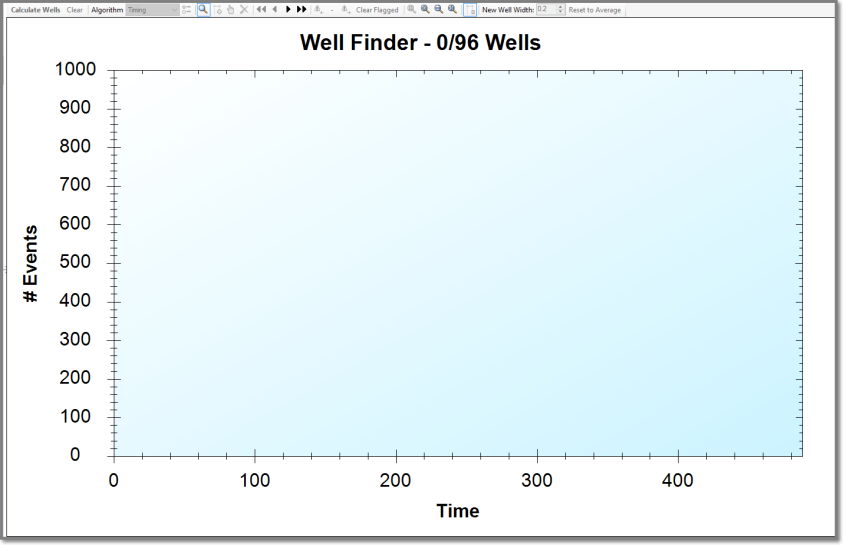
When you open Well Identification in a new experiment your screen will look like the following screenshot as your instrument begins acquiring events and iQue Forecyt® begins building the well data. Time on the X axis is seconds. #Events on the Y axis is the number of events iQue Forecyt® detected.

In the following screenshot example, you can see the peaks and valleys of the data stream and Well Finder (1) shows 0/96 Wells. The number of events (2) is 0 because no wells have been identified yet. Well Finder uses the information you specified in Design to make the determination that there are 96 wells.
